In today’s digital era, corporate IT infrastructure is becoming increasingly complex and requires fast, centralized, and real-time monitoring.
Disruptions to networks, servers, virtualization, storage, and security can directly impact business operations.
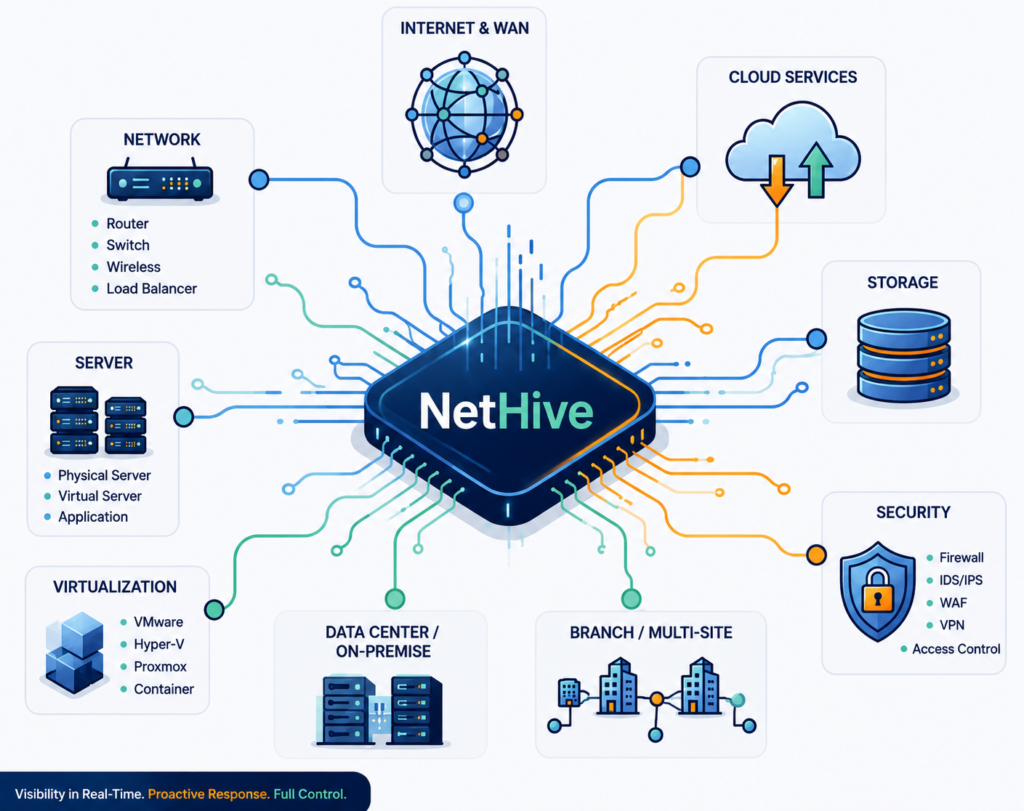
NetHive is a Unified Infrastructure Monitoring platform that helps organizations monitor their entire IT infrastructure through a single integrated dashboard.
With real-time visibility, proactive alerts, and end-to-end monitoring, NetHive helps improve service stability and minimize downtime.
IT Infrastructure Challenges
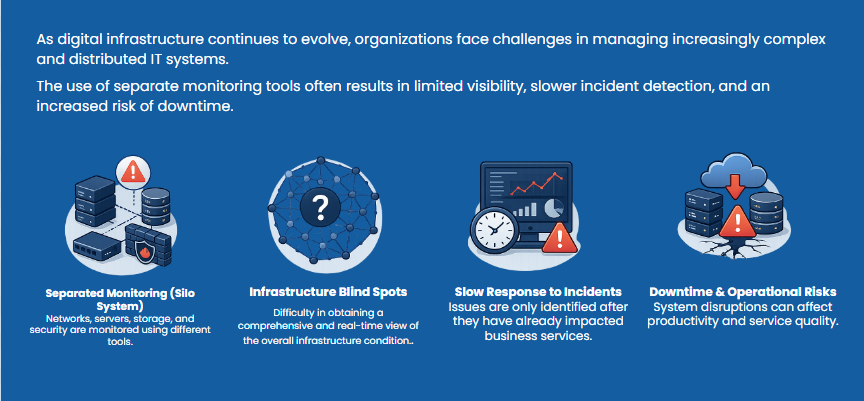
As digital infrastructure continues to evolve, organizations face challenges in managing increasingly complex and distributed IT systems.
The use of separate monitoring tools often results in limited visibility, slower incident detection, and an increased risk of downtime.
What is NetHive
NetHive is a Unified Infrastructure Monitoring & Observability platform designed to monitor the entire corporate
IT infrastructure ecosystem in a centralized, real-time, and proactive manner.
NetHive Observability Architecture
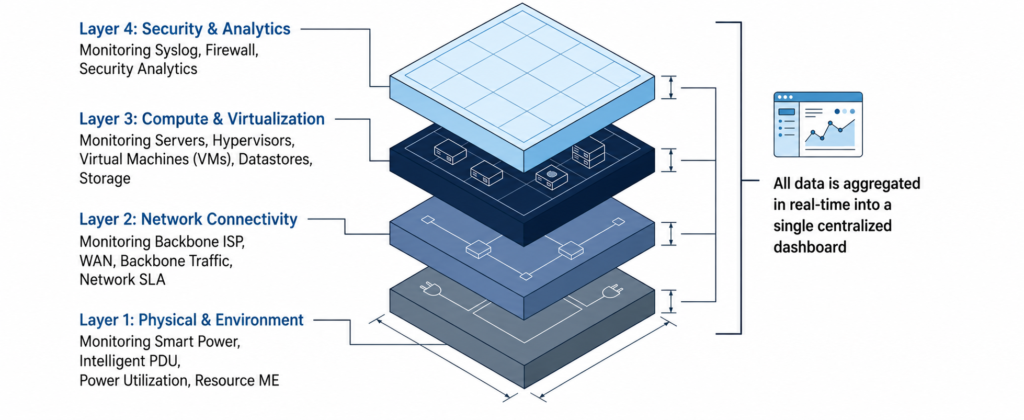
Monitoring End-to-End For Infrastruktur IT Enterprise
Benefits
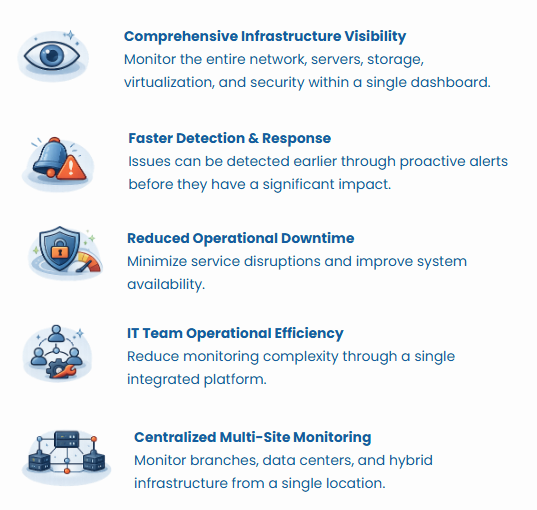
The implementation of NetHive helps organizations improve visibility, response speed,
and IT infrastructure stability through centralized and real-time monitoring.
Key Features
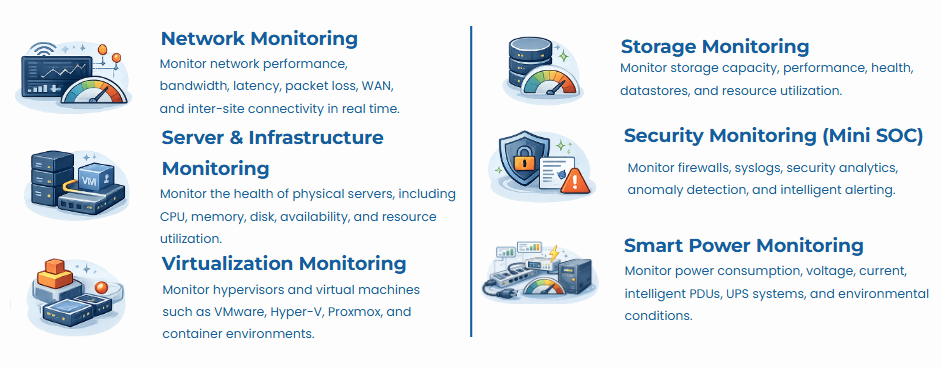
NetHive provides integrated monitoring capabilities for the entire IT infrastructure ecosystem within a single centralized platform.
Multi-Site Connectivity Visibility
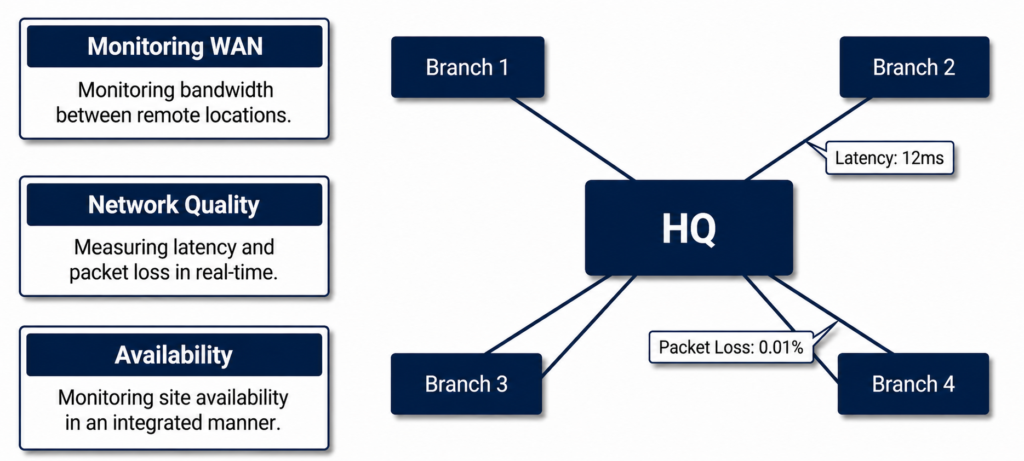
Monitor connectivity and infrastructure performance across branches and operational sites from a centralized platform.
Monitoring Infrastruktur Data Center
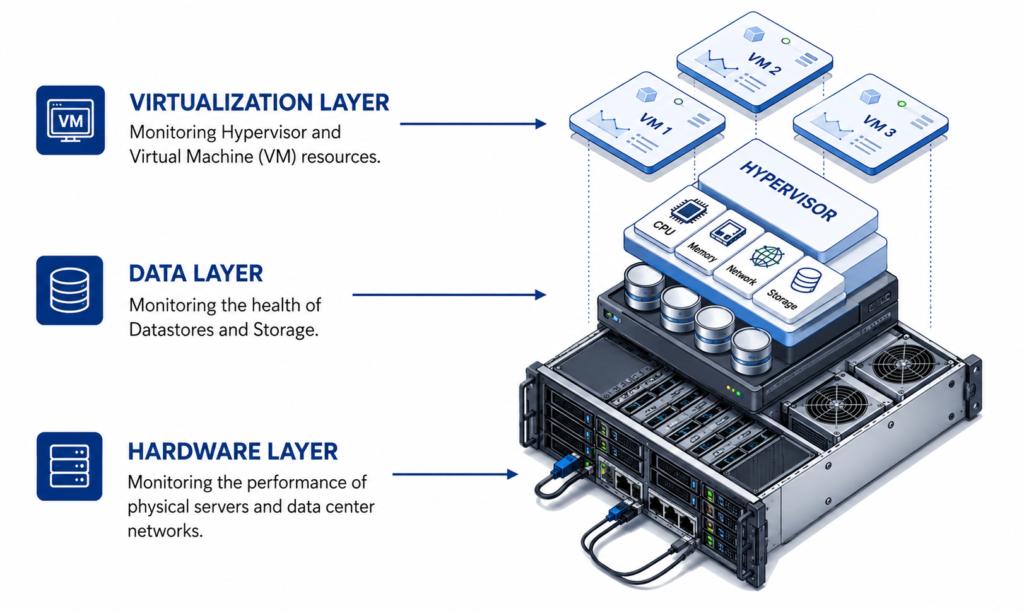
Ensuring optimal performance across modern and virtualized computing environments.
Mini SOC: Threat Detection
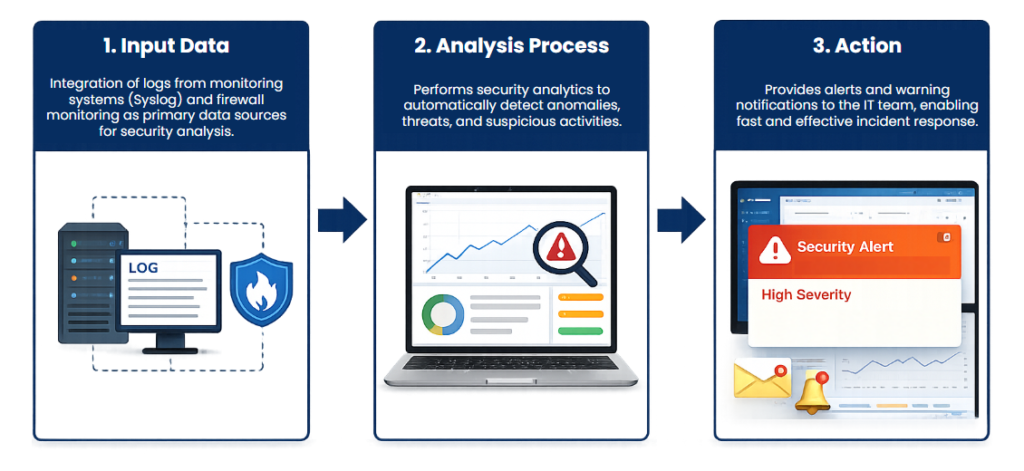
Integrated infrastructure security monitoring directly connected to your network performance monitoring.
Data Center Infrastructure Monitoring
Ensuring optimal performance in modern and virtualized computing environments.
Smart Power Monitoring Terintegrasi
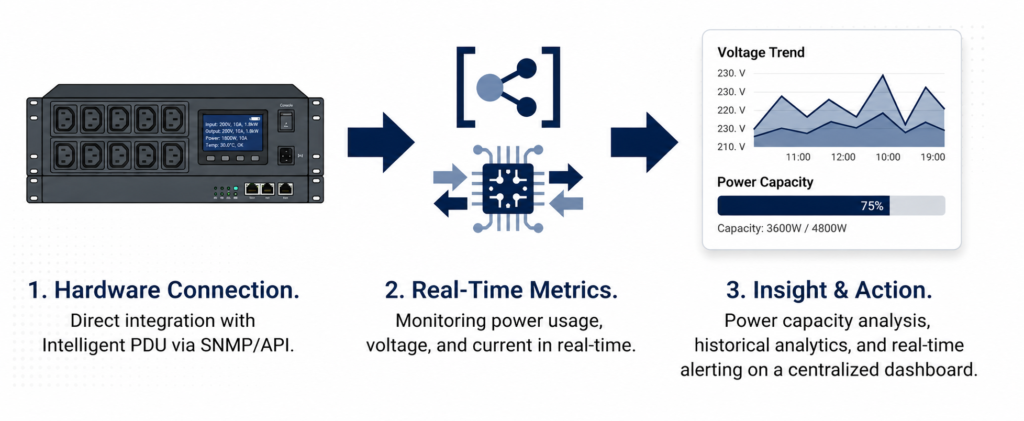
Monitoring power infrastructure consumption.
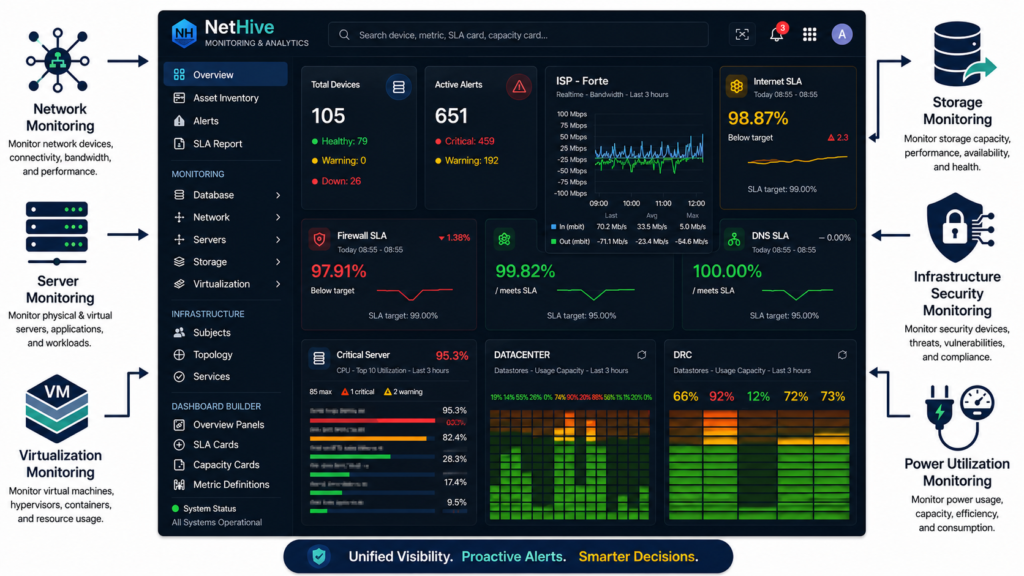
Infrastructure Monitoring Dashboard.
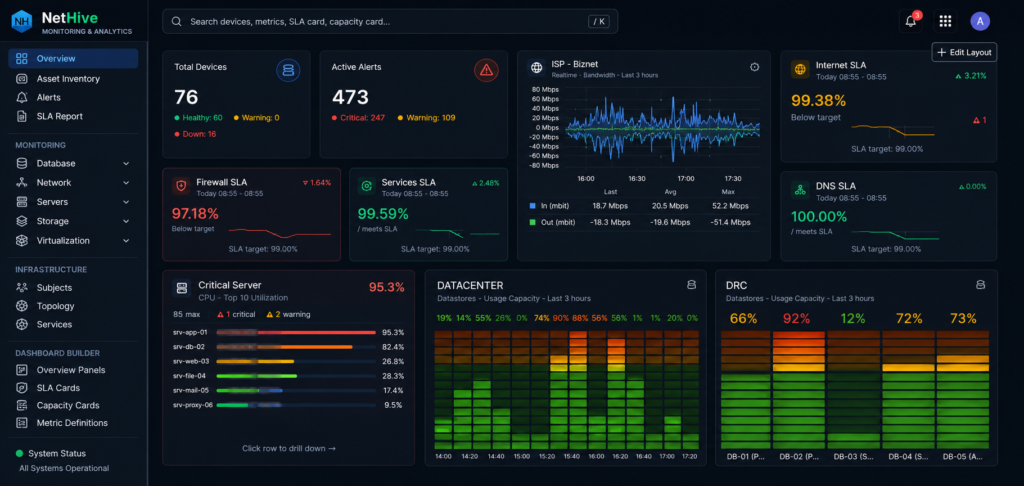
Centralized monitoring of IT infrastructure conditions and performance through a unified dashboard, focusing on device health,
service-level agreements (SLA), critical alerts, network performance, data center capacity, and service availability to support
early detection of operational disruptions.
SLA Cards
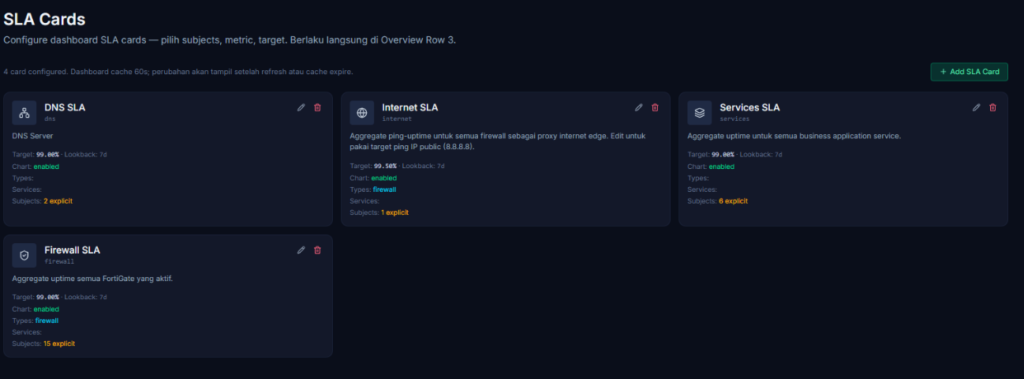
Centralized monitoring of IT infrastructure Service Level Agreement (SLA) performance, covering DNS services,
internet connectivity, firewall systems, and application services to measure service availability, uptime, response performance,
and SLA compliance against operational targets. This dashboard enables proactive monitoring, breach detection,
and performance evaluation to ensure stable and reliable service delivery.
SLA Monthly Report
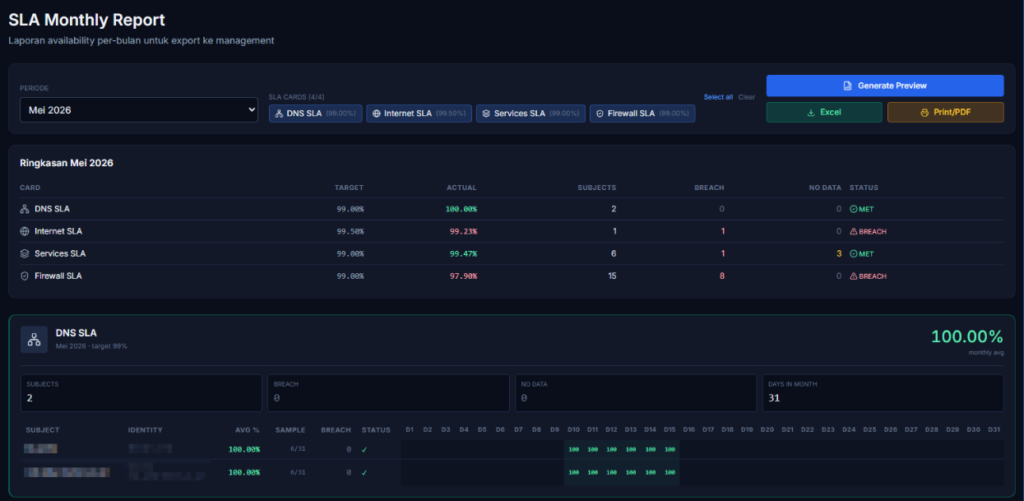
Centralized monitoring and evaluation of monthly IT infrastructure SLA performance through a unified dashboard,
focusing on service availability, SLA targets, breach incidents, and the performance of DNS, internet, firewall,
and application services for management reporting purposes.
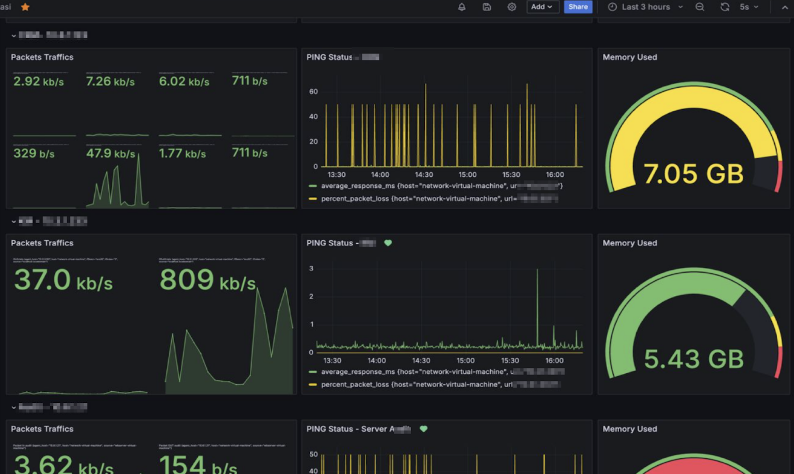
Infrastructure & Server Monitoring
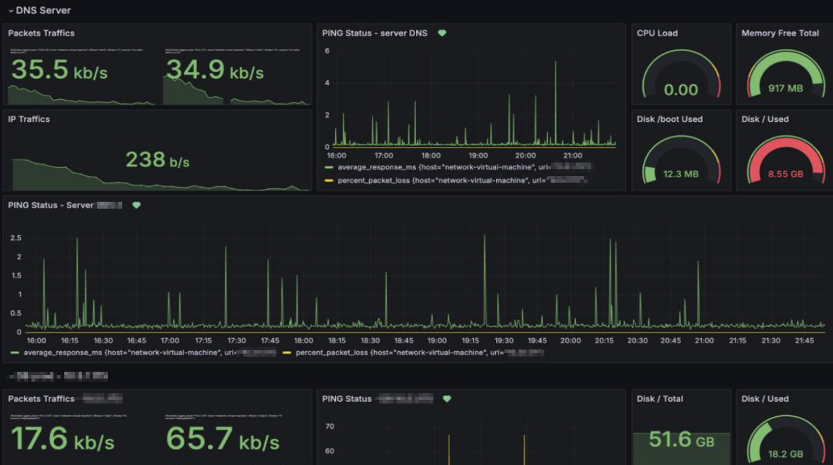
Real-time monitoring of server and IT infrastructure performance, covering network traffic, server availability, latency,
CPU and memory utilization, storage usage, and packet loss to ensure stable connectivity and optimal system performance.
Aplication Server Monitoring
Real-time monitoring of application server performance and health by tracking packet traffic to analyze application
and server traffic activity, ensuring service availability, responsiveness, and stable operational performance.
Monitoring VM
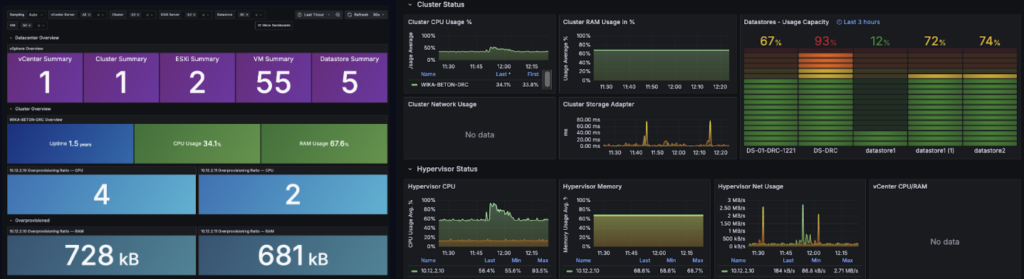
This dashboard is designed to monitor the condition and performance of VMware virtualization infrastructure in real time,
including CPU, RAM, storage, network, datastore utilization, as well as hypervisor and cluster status to ensure optimal resource
capacity and maintain system stability.
Dashboard Database
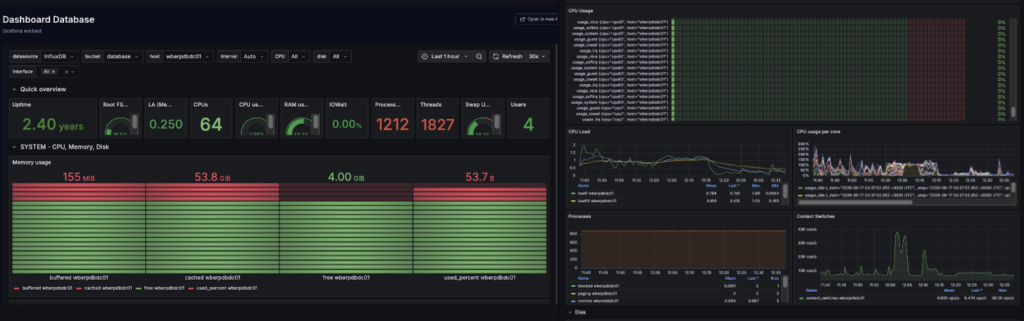
Centralized monitoring of database server performance through a unified dashboard, focusing on uptime, CPU usage,
memory utilization, disk performance, processes, threads, and system resources to ensure database stability
and optimal performance.
Multi-Site Monitoring & Network Connectivity
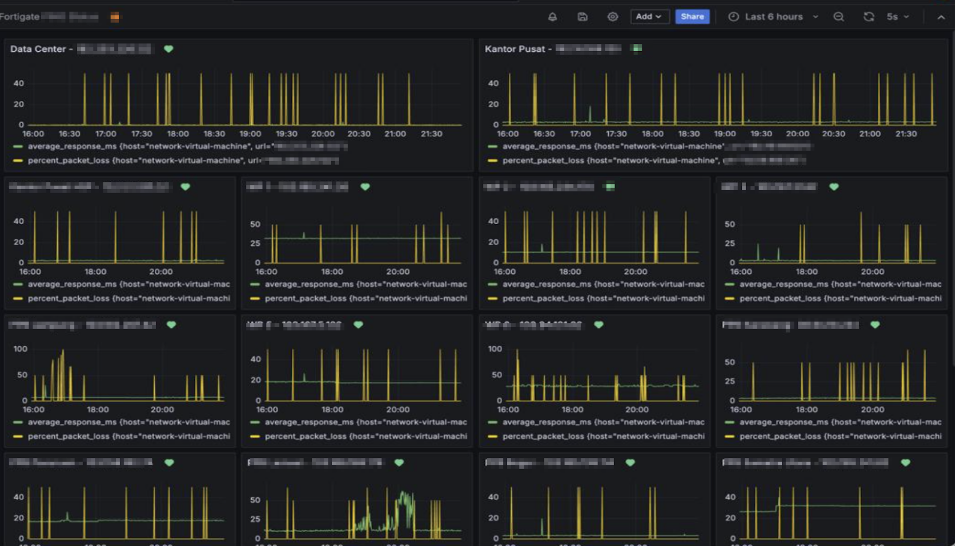
Centralized monitoring of network performance across multiple sites, branches, and data centers through a unified dashboard,
focusing on availability, latency, response time, and packet loss at each site to ensure stable and reliable connectivity.
Security Operation Centre (SOC)
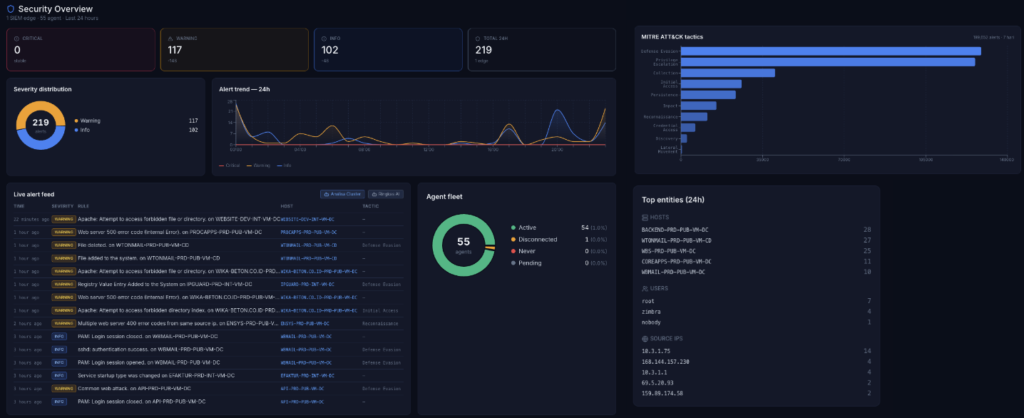
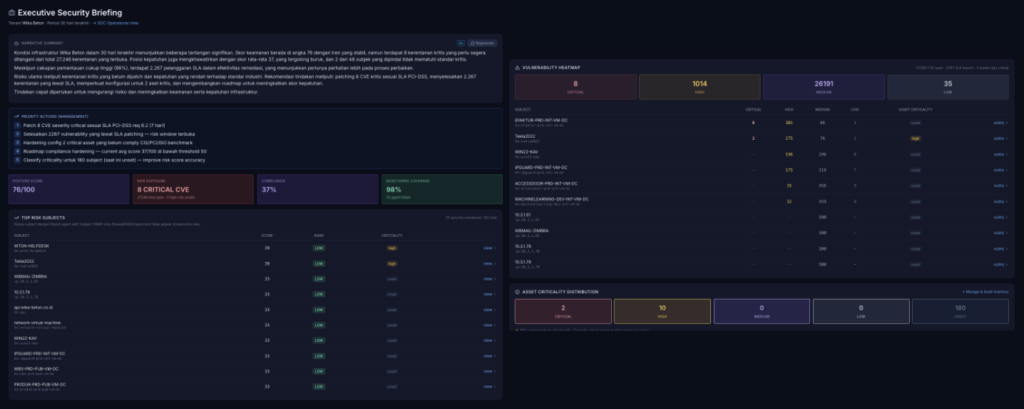
As a Security Operations Center, this centralized dashboard monitors device performance and network services in real time,
highlighting device status, uptime, latency, packet loss, CPU utilization, memory usage, bandwidth consumption,
and network session activities.
Infrastructure Health Dashboard
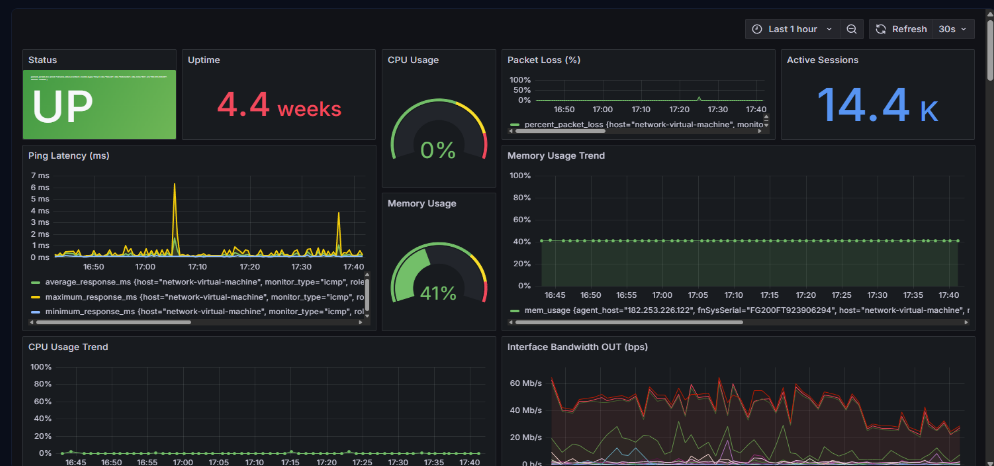
Real-time monitoring of device performance and network services through a centralized dashboard, focusing on device status,
uptime, latency, packet loss, CPU utilization, memory usage, bandwidth consumption, and network session activities.
Power Monitoring
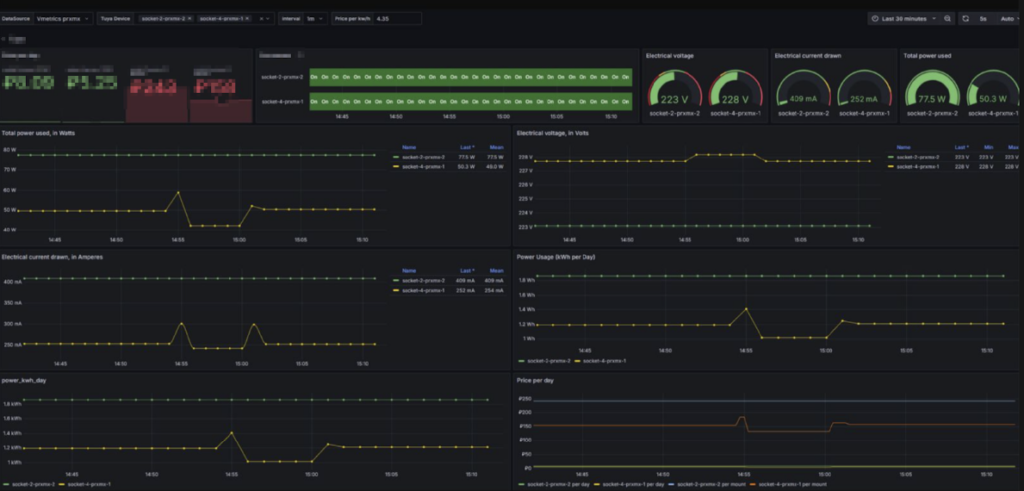
Real-time monitoring of power distribution infrastructure through a centralized dashboard, focusing on electrical voltage,
current consumption, power utilization, energy usage trends, operational status, and capacity monitoring to ensure efficient
power management, infrastructure reliability, and uninterrupted service availability.